Introduction
For
those of you that are living underneath a rock, options represent the
contractual right to purchase or sell blocks of 100 shares in the
underlying security. Because each option represents 100 shares, they
often provide volatile leveraged like returns and are often used by
either professional investors as part of a sophisticated investment
strategy or by retail gamblers investors as a way to potentially gain massive amounts of money while putting up a relatively small amount.
In this post, I will walk you through the pricing fundamentals, the Greeks, and common option strategies. Hopefully, by the end of this post, you will stop losing all your money like a bunch of half-wits. Well, you probably still lose money, but at least you can act like a smartass about it.
Pricing Fundamentals
This section is going to be focused on the fundamentals and theoretical aspects behind what gives an option value. Aka, that boomer shit.
There are two types of options: American and European. American options give the holder the right to exercise the option at any given time prior to the expiration date (cause freedom, that’s why). These options are the ones you typically buy from your broker. European options on the other hand are fucking gay because they only let you exercise at the expiry date and since none of you cucks ever bought an option from a Europoor before, I will focus solely on American options for this DD post.
Value Breakdown
Every option, regardless if it’s a chad call or a gay put has two pricing components that justify it’s current market value: the intrinsic value and the speculative value. Let me explain via this equation:
Value = Intrinsic + Speculative Value
Intrinsic value is how ITM an option is, and the speculative value is the chances of it becoming even more ITM by the time to expiry. For example, assume a call option has a strike of $10 and the current price of the stock is $12. That would mean the intrinsic value is $2. However, the option expires in let’s say 3 months, and is being traded at $3. That would mean the additional 1-dollar difference above the $2 is the speculative value of the option. That $1 represents investors speculating the option will become even more ITM within that three months time frame.
Taking that logic further we can derive the fundamental value for a call and put option as:
Call = stock price – strike + speculative
Put = strike – stock price + speculative
Leverage
Now that you know that a single option grants you exposure to multiple shares and the returns are therefore leveraged, you might be thinking to yourself oh gosh, I hope there is a way for me to calculate exactly how leveraged this option will be. Don’t worry, there is. You can calculate exactly how leveraged an option is via this equation:
(Option Delta x Share Price) / Option price
To give you an illustration, let's assume you buy a long-term SPY call trading at $10 a contract with a delta of 0.5 while SPY is being traded at $340 a share. Putting these numbers into the equation you get the following:
(0.5 x 340) / 10 = 17. What this means is that this option lets you be leveraged 17:1 on a single call option. So if you put let's say $1,000 into this call or purchase 1 contract, you have a position that is equal to $17,000 on the SPY.
Given this example, you should now come to realize why options are extremely risky and should not be taken lightly. If there is one thing to take away from this is that you need to be aware of the amount of risk options carry and you need to allocate your capital effectively.
Volatility
This is the big one. If the market is a casino, then this is the bookie playing around with the odds on the board. So if you want to leave the casino with money and not another man’s dick in your hand, you need to know volatility cold. For options trading, there are two kinds of volatility: realized and unrealized.
Realized
All you need to know is that realized volatility is the historic price movement of the stock. It is measured as the standard deviation (or deviation from average price) from the average price of a stock in a given time frame.
Unrealized Or Implied Volatility
This is the most important of the two. To put it in simplest terms, IV is the expected magnitude of a stock’s future price changes expressed as an annual percentage.
This expected yearly price change can be expressed as the following:
1-Year Expected Range = stock price +/- (stock price x IV)
What is important with this formula is that it shows the riskier stocks usually have higher IVs which will result in a larger annual expected range. Taking this a step further we can also visualize the expected stock price changes via standard deviations.
Assuming most of you passed high school, a fair amount of you must be somewhat familiar with the normal distribution graph and the confidence interval (if not, don't worry about it, I'm going to baby you through this). We can demonstrate expected stock volatility with a graph of a normal distribution that shows a 1 standard deviation of the price movement of a stock that is trading at $100 with an IV of 25%. In statistics, when we have a standard deviation of 1 we can say that we have a confidence of 68% that the stock will trade within this range. Plugging in the stock price of $100 with an IV of 25% into the equation we get:
100 +/- (100 x 0.25 ) = 125 and 75.
This means that with a standard deviation of 1 we can say that there is a 68% chance the stock will trade within the range of $75 - $125.

We can also take it a step further and do a 2-standard deviation which will give us a representation of a stock’s fluctuation with a 95% confidence interval. In the chart below, still assuming a stock price of $100 and an IV of 25%, the range has doubled to $50 - $150. Remember, in statistics, we can go all the way to 3-standard deviations which is a confidence interval of 99.7% and that will mean a range of $25 - $175.

Now that your high school nostalgia is out of the way, there is one more useful tidbit of knowledge I will show you.
We can also calculate the stock’s expected move over any period via this equation:
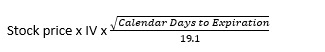
This way whenever you buy an option that doesn’t expire in one year exactly, you can still map out the expected price range as stated by option traders. That way, you know what you are getting into and be all surprised when a dick is shoved up your ass (unless you’re in to that, then call me).
Greeks
What you all need to know is that within the premiums of every option that you buy there are certain assumptions that are priced in, much like there are certain assumptions that are priced into a stock price. These assumptions are often represented by certain Greek letters and by understanding what they are and how they influence the option’s value, you can better understand what you are betting on and whether or not the risks are tilted in your favor.
In this part, I am going to talk about the four Greeks every last one of you degenerates must know by heart: Vega, Delta, Gamma, and Theta. And no, they aren’t the name of the fraternity your girlfriend goes to so that she can blow half the chads on campus. These guys are the ones that will determine whether you make actual life-changing money or move back to your mother’s basement while your new stepdad subtly judges you.
Vega (V): This represents the change in option price per change in the option’s implied volatility. Vega is highest when the stock price is at the strike price and when the option is farther out from the expiration date.
Ex: Let’s assume the premium of an option is 7.5, IV is at 20% and vega at 0.12. If the IV moves up from 20 to 21.5, that is a 1.5 increase. The option price will increase by 1.5 x 0.12 = 0.18. 0.18 + 7.5 = 7.68
Delta (Δ): Delta is a change in the option’s price due to a change in underlying stock price. Assuming we have a delta of 0.5, that means per every dollar the stock price goes up by, the option premium will go up by 50% of that change. Delta is often highest the farther ITM the option is and will often be the most volatile the closer the strike price is to the stock price. Call options have a delta of 0-1 while Puts have a negative delta of 0 – (-1). The absolute delta of an option also tells you the probability that the option will finish in the money.
Gamma (T): Gamma is the rate of change in an option’s delta per 1-point move in the underlying’s share price. It is essentially the first derivative of delta and is used to gauge the price movement of an option relative to how far OTM or ITM it is. Taking this further, gamma is also the second derivative of an option’s price with respect to the underlying share’s price. This is because the delta is the first derivative of share price and since gamma is the first derivative of the delta, it is, therefore, the second derivative of the share price.
Whenever you long an option, you have positive gamma exposure and when you short, you have negative gamma exposure.
It is also important to note that gamma approaches 0 the farther an option becomes OTM or ITM. Gamma is also at its highest when the strike is ATM.
Ex: assume an option has a delta of 0.5 and a delta of 0.1. This means per every dollar increase of the underlying stock, the delta would increase by the gamma amount. So in this case it is 0.5 + 0.1 = 0.6. Conversely the opposite happens as well if the stock price go down by a dollar which will bring the new delta to 0.4. The change in an option's delta is better illustrated in the next section where the delta curve is discussed.
Theta (O): This Greek is probably the easiest to understand. Theta is the time decay of an option as it approaches its expiration date. This means that theta measures the constant and steady decrease in the extrinsic value for an option on a daily basis. If the theta for an option is -0.02, then every day, as sure as the sun rises in the east, your option is going to lose $2.
Delta Curve:
For those of you that don’t know, the delta of an option is not stagnant, and its rate of change in accordance with share price changes is represented by the option’s gamma. You can actually map out the expected change in an option’s delta in accordance with the underlying share price via the delta curve.
Let me show you the delta curve for a call option:

